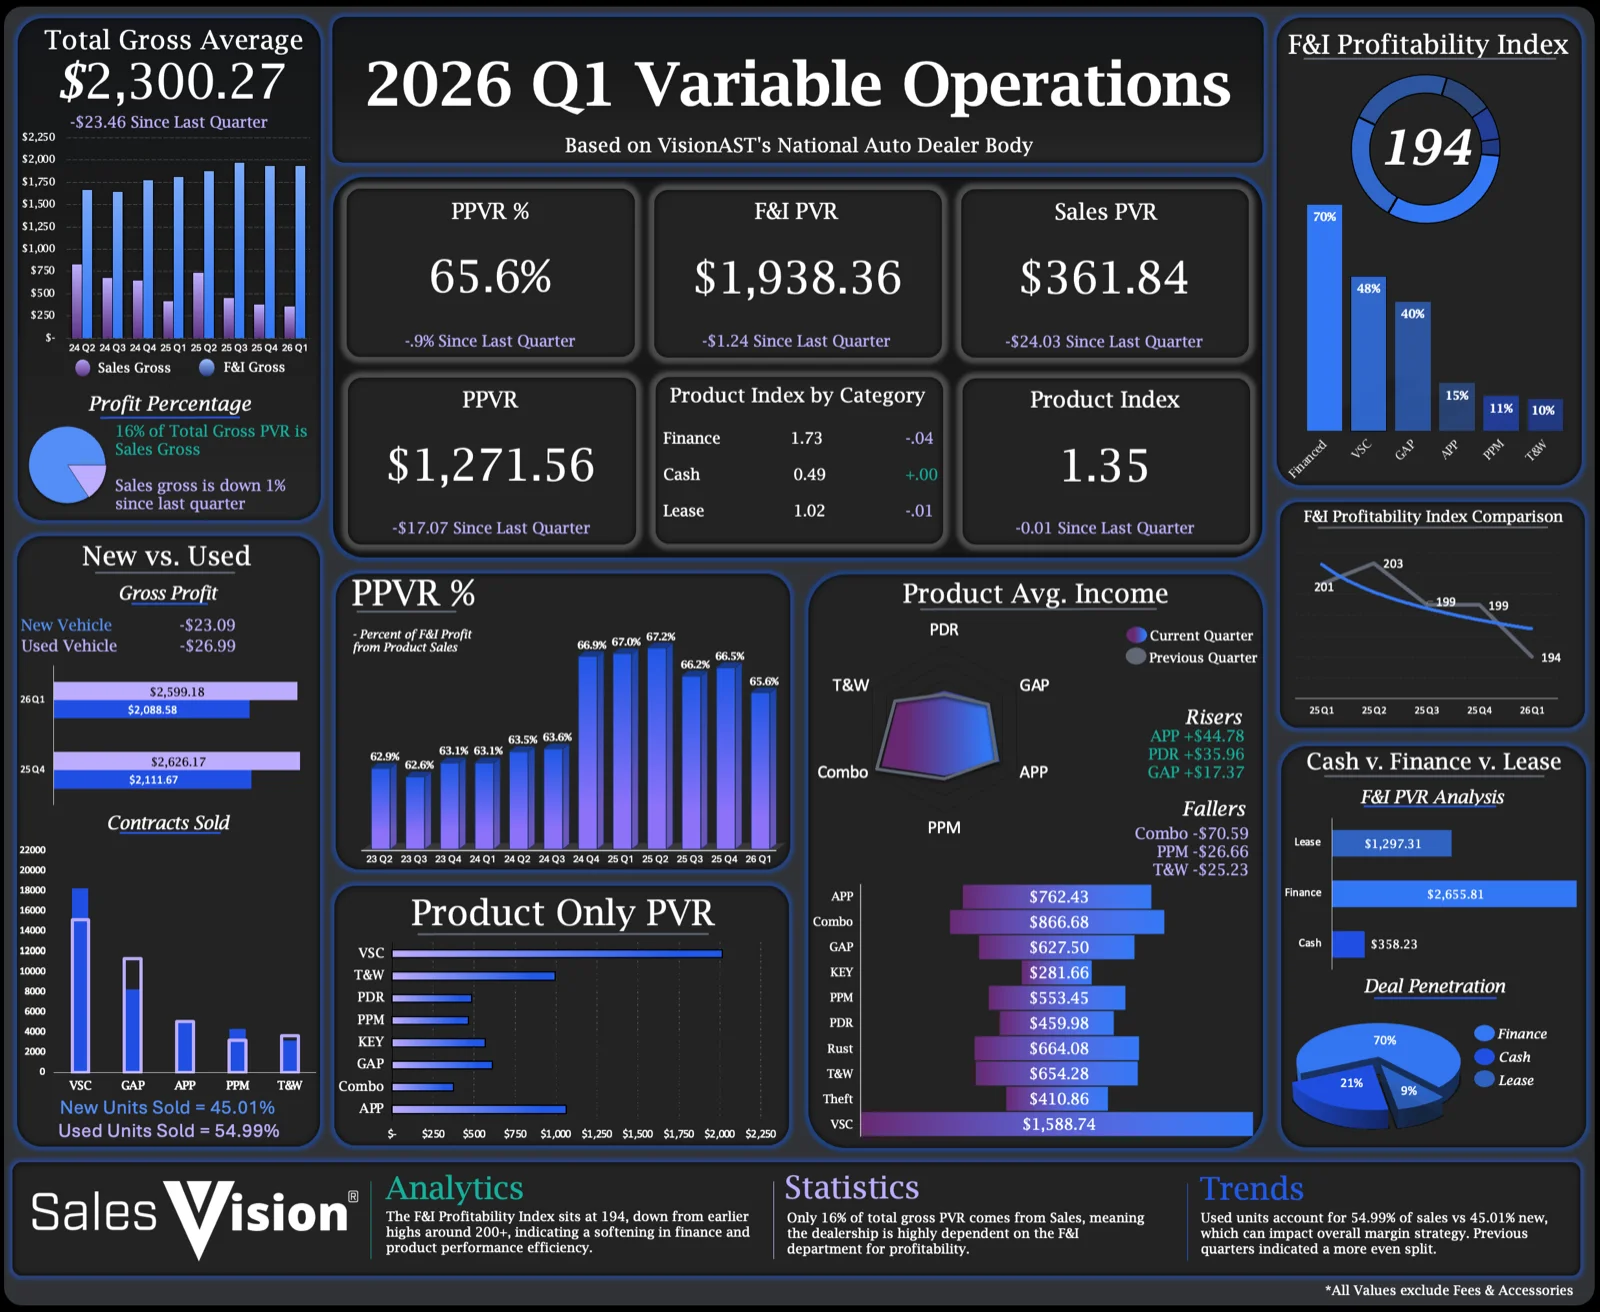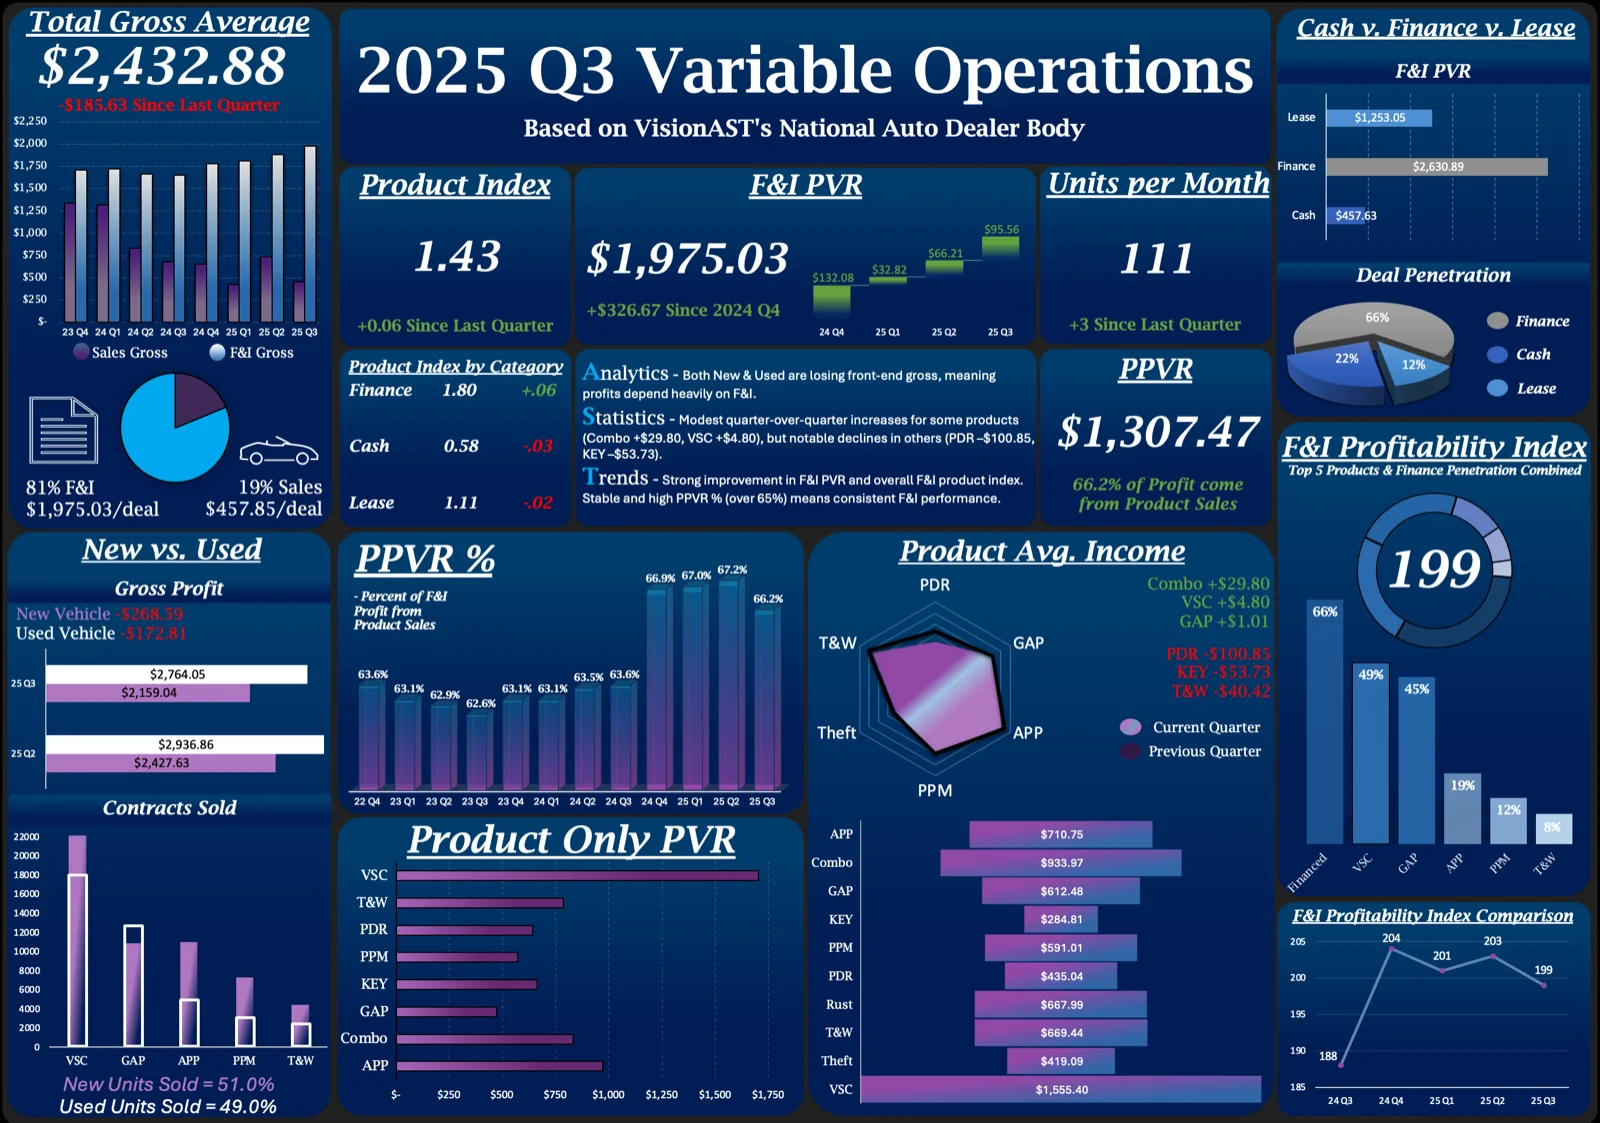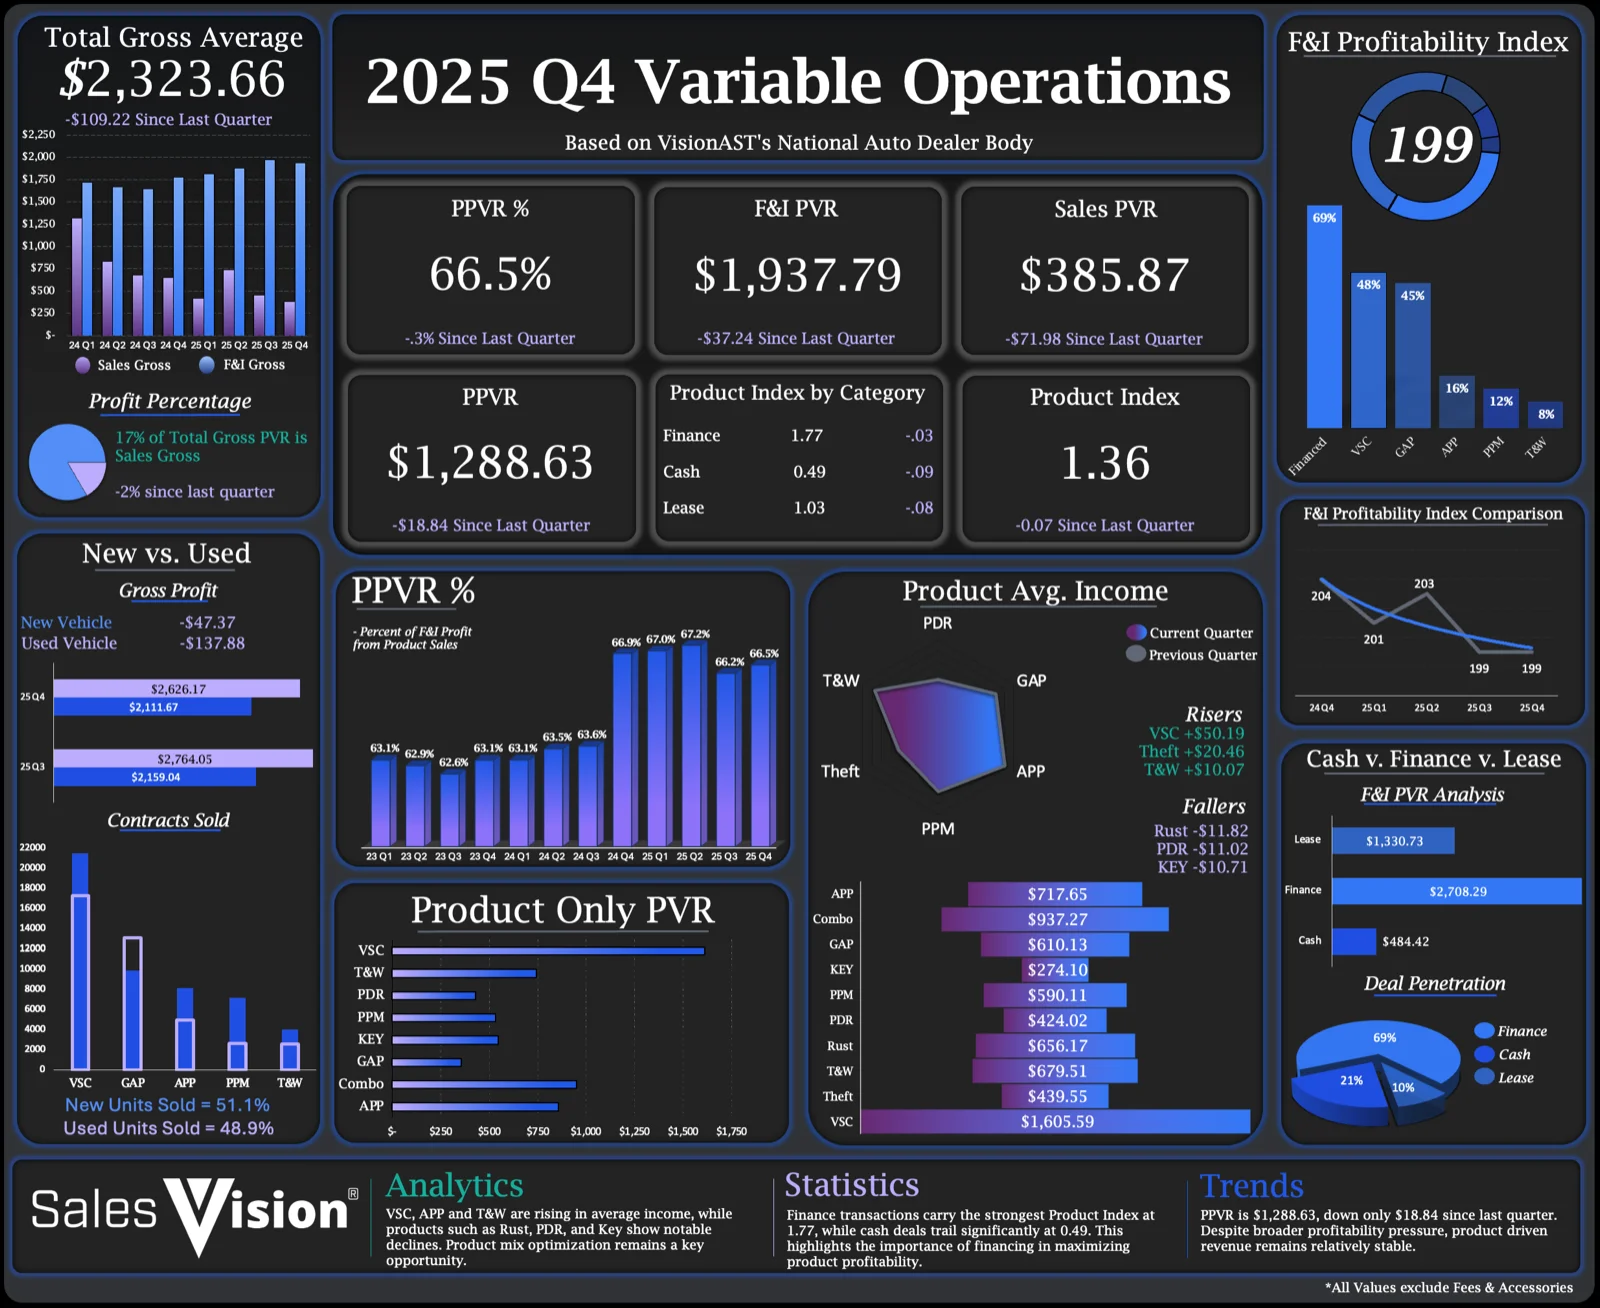
Q4 results show moderate pressure on overall profitability, with Total Gross Average declining slightly to $2,323.66 per deal. While front end Sales PVR remains limited, backend performance continues to carry the operation, with F&I generating the majority of total profit per unit. This imbalance underscores the growing reliance on finance and product execution to sustain results.
Product-driven income remains relatively stable despite a small decline in PPVR percentage, indicating that attachment rates and pricing discipline are holding but beginning to soften. Products per deal declined modestly, signaling early signs of efficiency erosion rather than a sharp downturn. Finance transactions continue to outperform cash and lease deals by a wide margin, reinforcing financing as the most effective profit channel.
From a product perspective, Vehicle Service Contracts, Appearance, and Tire & Wheel stand out as top contributors, while several protection products show declining average income. VSC rising $50.19/deal was a lone bright spot for the 2025 Q4 product analysis.
Moving forward, sustaining profitability will depend on strengthening product penetration in cash and lease deals, correcting underperforming products in terms of average income and penetration, and stabilizing backend execution as market conditions tighten.
Want to See How Your Store Stacks Up?
Whether you’re an owner/operator, F&I agency, or performance manager, the Q4 2025 Benchmark Report is a valuable tool to track performance and drive operational excellence.
For a personalized review of how your dealership compares to national benchmarks, reach out to Kyle Reid from VisionAST for a demo of SalesVision, FinanceVision and/or ServiceVision reporting platforms. These tools were designed by dealers, offering intuitive dashboards, accurate reporting, and actionable insights that simplify decision-making at every level.
Kyle Reid
VP of Strategic Partnerships
904-315-4767
kreid@visionast.com