VisionAST has released its Q2 2025 Quarterly Benchmark Report, providing a comprehensive analysis of powersports dealership performance across both variable and fixed (parts and service) operations. These insights are derived from real-time data aggregated from VisionAST’s growing client base of powersports dealers nationwide, all integrated through the Lightspeed DMS.
The report allows dealer principals, general managers, and F&I agencies to assess their operational performance against national benchmarks, identify profitability trends, and pinpoint opportunities for growth within their dealership.
Q2 2025 Highlights – Variable Operations
As the powersports market continues to normalize post-COVID and inventory availability stabilizes, dealerships are shifting focus back to margin optimization and product penetration. Key trends from Q2 include:
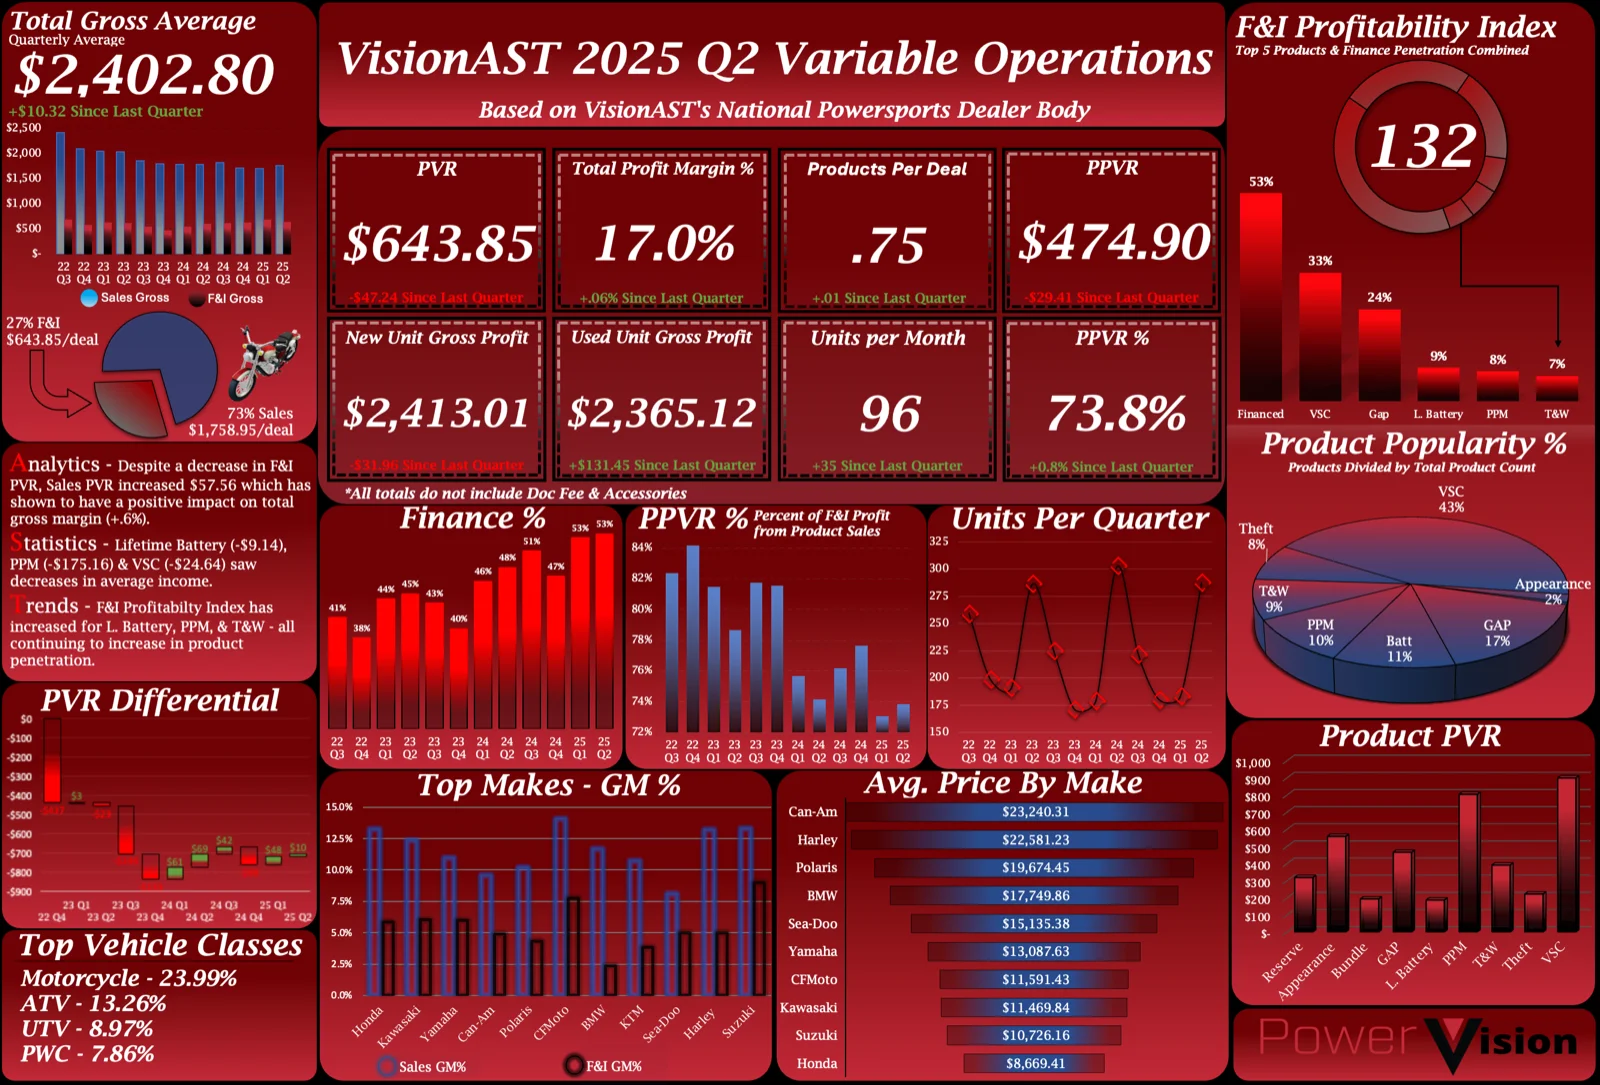
- Products per deal increased by 0.5 units over Q1 2025, indicating stronger F&I product adoption across units sold.
- F&I PVR (Per Vehicle Retailed) saw a $32.77 increase, even as pricing pressure on certain products impacted individual profitability.
- While F&I PVR was slightly down sequentially, Total Sales PVR rose by $57.56, lifting total front-end gross margin by 0.6% quarter-over-quarter.
- Average income per deal decreased for several core products:
- Lifetime Battery: down $9.14
- Prepaid Maintenance (PPM): down $175.16
- Vehicle Service Contracts (VSC): down $24.64
- The F&I Profitability Index—which blends top product penetrations and total financed penetration—showed a positive uptick, with increases in penetration for Lifetime Battery, PPM, and Tire & Wheel protection products. This signals a trend toward higher attachment rates despite lower per-unit revenue.
Q2 2025 Highlights – Fixed Operations
As dealership service departments continue to grapple with technician shortages and fluctuating RO volume, fixed operations remain a critical area for sustained profitability. Key fixed ops data points include:
- The Effective Labor Rate dropped slightly to $121.59, a $3.69 decrease from Q1. This could reflect seasonal pricing adjustments or strategic discounting to maintain throughput during early summer.
Want to See How Your Store Stacks Up?
Whether you’re an owner/operator, F&I agency, or performance manager, the Q2 2025 Benchmark Report is a valuable tool to track performance and drive operational excellence.
For a personalized review of how your dealership compares to national benchmarks, reach out to Kyle Reid for a demo of the PowerVision and ServiceVision platforms. These tools are designed specifically for powersports dealers on Lightspeed, offering intuitive dashboards, accurate reporting, and actionable insights that simplify decision-making at every level.
Kyle Reid
VP of Strategic Partnerships
904-315-4767
kreid@visionast.com