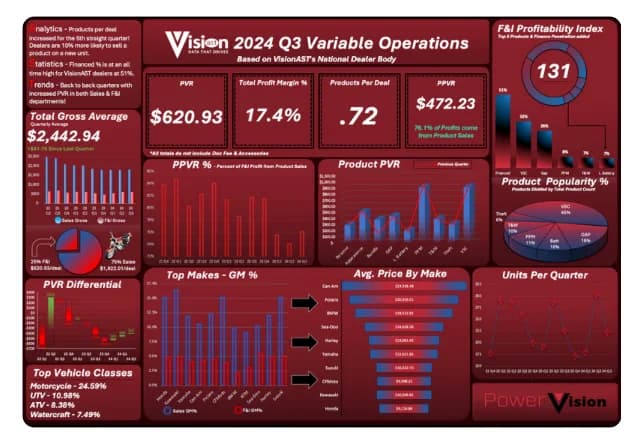
VisionAST recently released to customers, their Q3 2024 performance benchmark report, which encompasses performance of their entire dealership client base for both variable operations and parts and service. Dealers can use the report to compare their own operation to the complete aggregate of metrics.
Some key Q3 trends worth noting:
Variable Operations
- Back-to-back quarters with increased sales and F&I PVR
- Sales gross PVR increased $31.90/deal (+$4.25/deal Q2 2024)
- F&I gross PVR increased $9.85/deal (+$64.25/deal Q2 2024)
- Products per deal has continued to increase for the past 5 quarters (.58 to .72)
- Products per deal on new units is 10% higher than on used units
- Finance penetration is highest in VisionAST history at 51%
- Previous high was 48% in Q2 2024
Fixed Operations
- Revenue Per Billable Flat Rate Hour increased $3.50/RO compared to last quarter
- Effective Labor Rate has significantly increased since Q3 2023 (+$6.11)
- Q3 2023 average = $136.54
- Q3 2024 average = $142.65
- Parts % of Total Gross has reached 20% of profit for the first time since VisionAST tracking began in Q1 2023
- Parts Profit % on Parts Invoices is down 0.42% compared to Q3 2023
- 2023 Q3 avg = 32.31%
- 2024 Q3 avg = 31.89%
The general trend for 2024 is that of an increased focus on F&I profitability. For many dealers F&I is uncharted territory with plenty of room for growth. Service and parts profitability continues to remain front and center as major unit sales volume remains uncertain into 2025.
Curious how your dealership’s performance compares to the averages for Q3 2024?
Contact Kyle Reid for a walk-through of our PowerVision and/or ServiceVision platforms and see how this reporting tool is benefiting Lightspeed powersports dealers across North America.
Kyle Reid
VP of Strategic Partnerships
904-315-4767
kreid@visionast.com