VisionAST recently released to customers, their Q1 2026 quarterly benchmark report, which encompasses performance of their entire powersports dealership client base. Dealers can use the report to compare their own operation using the live data available to them on the VisionAST platform.
As we close out Q1 2026, one thing is clear: profitability in powersports is shifting—and the dealers who recognize it early will win the year.
Using data from VisionAST’s national dealer body, we analyzed performance across sales, F&I, and product metrics to uncover where growth is happening—and where opportunity still exists.
The Big Story: F&I Is Driving Growth
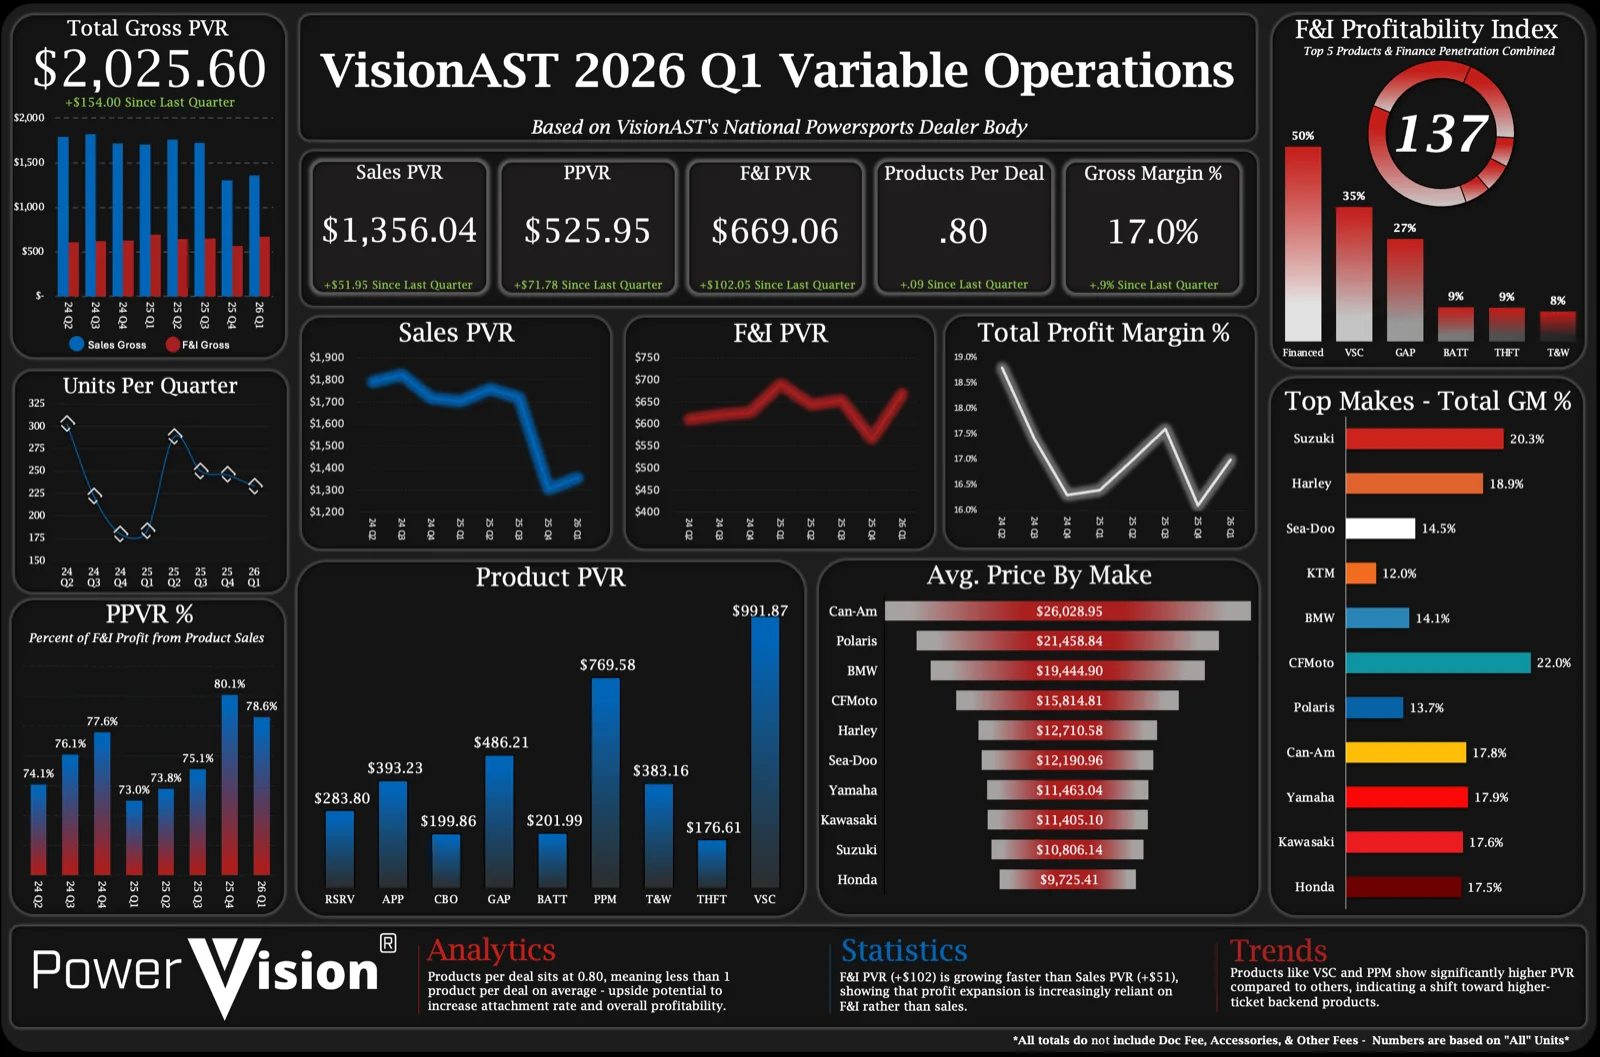
While total gross per vehicle retailed (PVR) climbed to $2,025.60 (+$154 QoQ), the composition of that growth tells the real story.
F&I PVR increased by +$102, nearly double the gain in Sales PVR (+$51).
That’s not just incremental improvement—it’s a shift in where profitability is being created.
What it means:
Dealers are becoming less reliant on front-end margins and more dependent on F&I performance to drive overall profitability.
The Opportunity Gap: Products Per Deal Is Still Under 1.0
Despite stronger F&I results, products per deal sits at just 0.80.
That means, on average, not every deal includes a single product.
Let’s be direct:
This is one of the biggest untapped opportunities in the industry right now.
Even modest improvements here—getting closer to 1.2–1.5 products per deal—could dramatically increase both:
- F&I PVR
- Total gross per unit
Margin Pressure Is Real
Total profit margin sits at 17.0%, with modest improvement quarter-over-quarter.
But the trend line tells a more nuanced story:
- Margins dipped mid-period before recovering
- Sales PVR showed volatility and a late-quarter drop
- Units fluctuated significantly across quarters
Translation:
Revenue is growing—but not always efficiently.
Dealers need to focus not just on selling more, but on maximizing each deal.
Product Mix Matters More Than Ever
Not all products are created equal—and the data proves it.
Top-performing categories like:
- VSC (Vehicle Service Contracts)
- PPM (Prepaid Maintenance)
…are generating significantly higher PVR compared to backend products like:
- Tire & Wheel
- Theft protection
Insight:
Dealers who prioritize high-value products—and train teams to present them effectively—are seeing outsized gains.
Brand-Level Insights: Pricing vs Profitability
There’s a clear disconnect between average unit price and gross margin by make.
For example:
- Some premium brands command higher prices but don’t lead in gross margin %
- Others (like CFMoto in this dataset) outperform in margin efficiency
Takeaway:
Higher MSRP doesn’t automatically equal higher profitability.
Inventory strategy and F&I execution matter just as much as brand mix.
The Trend to Watch: Backend Is the New Battleground
The data points to a growing industry reality:
Profitability is moving downstream.
With front-end pricing pressure, rising competition, and more informed buyers, the backend is becoming the most controllable—and scalable—profit center.
What Dealers Should Do Next
To capitalize on these trends, dealers should focus on three key areas:
1. Increase Product Penetration
- Set a target above 1.0 products per deal
- Audit presentation consistency across your team
2. Prioritize High-PVR Products
- Lead with VSC and maintenance offerings
- Bundle products strategically to increase value perception
3. Use Data to Drive Decisions
- Track performance by make, product, and manager
- Identify where deals are being left on the table
Final Thought
Q1 didn’t just show growth—it showed where growth is coming from.
The dealers who lean into F&I, improve product attachment, and refine their process will separate themselves quickly in 2026.
The rest will keep chasing volume—and wondering why margins aren’t following.
How are you tracking these metrics and holding individual team members accountable?
Want to see how your store stacks up?
Whether you’re an owner/operator, F&I agency, or performance manager, the Q4 2025 Benchmark Report is a valuable tool to track performance and drive operational excellence.
For a personalized review of how your dealership compares to national benchmarks, reach out to Kyle Reid from VisionAST for a demo of the PowerVision and ServiceVision reporting platforms. These tools are designed specifically for specialty dealers, offering intuitive dashboards, accurate reporting, and actionable insights that simplify decision-making at every level.
Kyle Reid
VP of Strategic Partnerships
VisionAST
904-315-4767
kreid@visionast.com