VisionAST has just released its Q2 2025 Benchmark Report, providing a comprehensive look at the performance of automotive dealerships across both variable operations and fixed ops (parts and service). This report, based on live data from the VisionAST platform, gives dealers a powerful tool to measure their performance against industry peers.
While the broader industry may be facing uncertainty, the data tells a different story for dealers who stay focused on their own operations. Those who are locked in on the day-to-day details within their four walls are continuing to grow. F&I profitability is at near record highs-and the dealers who prioritize ongoing training and team development are seeing measurable results.
Mid-summer is a great time to reflect on what is working well and what needs fine tuning as dealers roll trough the second half of the year:
- Which department in my dealership needs greater focus, process improvements, or stronger accountability?
- Am I setting clear, actionable goals for each area of the business?
- How am I tracking progress, and how often am I bringing these insights into team meetings?
Now is the time to fine-tune internal processes and get laser-focused on execution. Knowing where your operation stands today - and where you want to go - can make all the difference in capitalizing on every opportunity that comes through your door.
Some key Q2 trends for variable operations worth noting:
Q2 2025 Highlights – Variable Operations
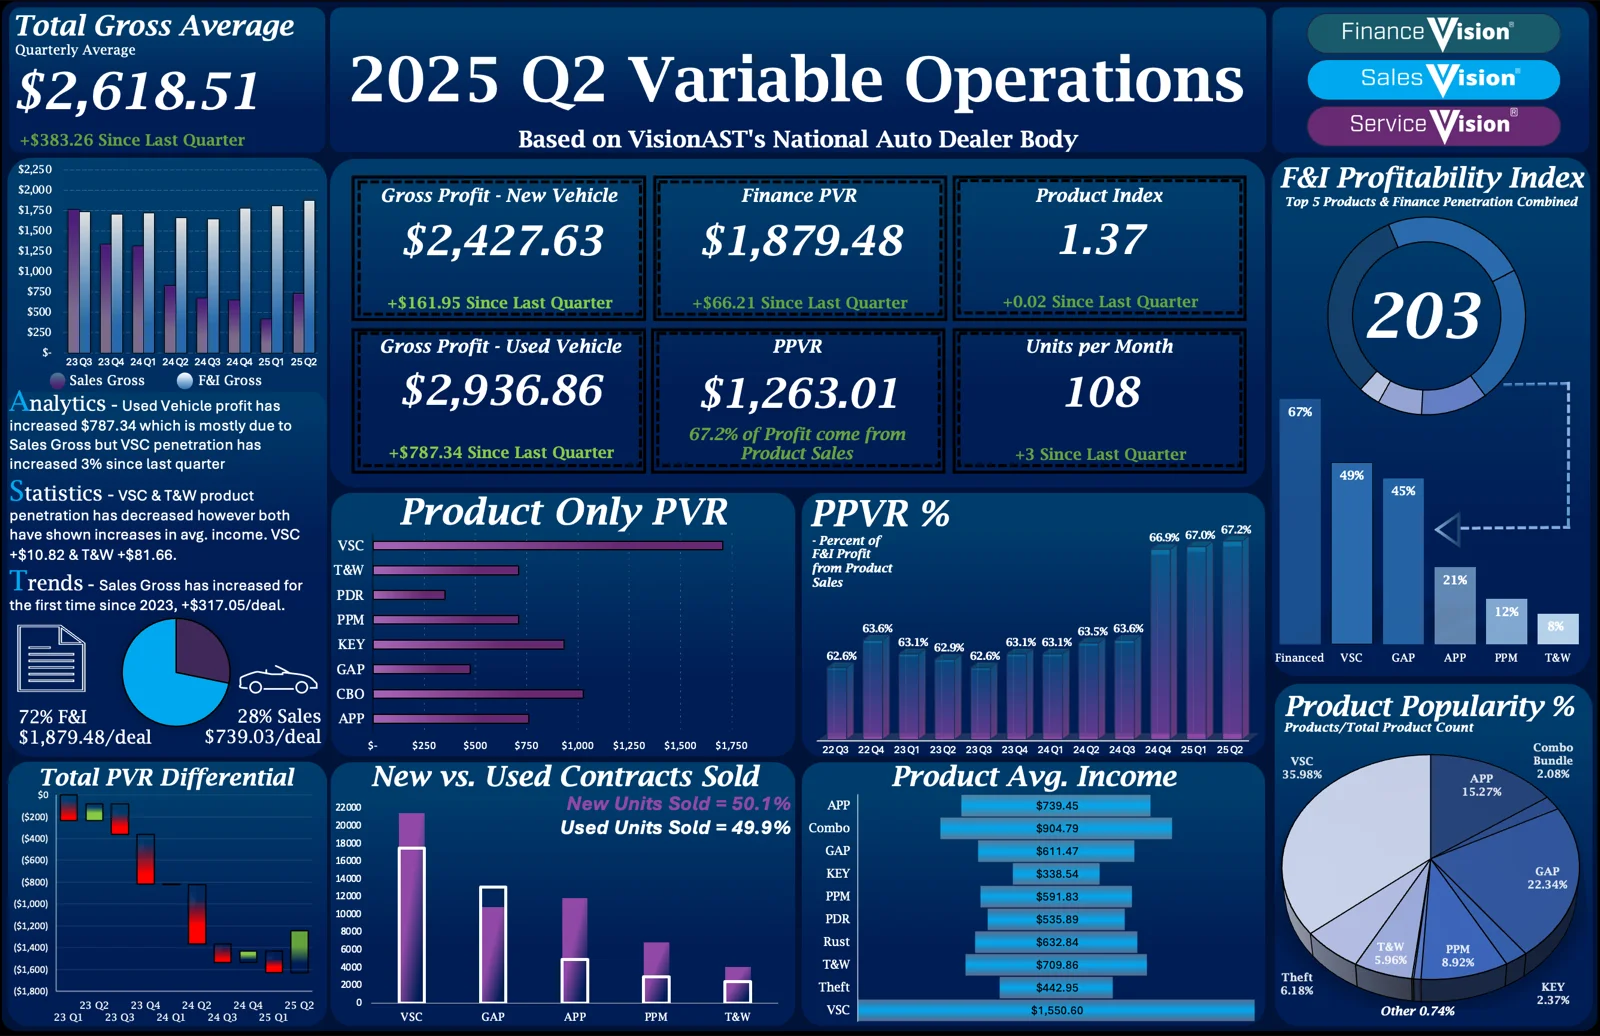
- Sales Gross PVR reached $739.03 per deal, an increase of $317.05 over Q1 2025.
- Used Vehicle Total Profit increased by $787.24 compared to Q1, largely fueled by sales gross gains and a 3% uptick in Vehicle Service Contract (VSC) penetration.
- Despite penetration declines in both VSC and Tire & Wheel protection products, average income per deal for these offerings rose — VSC up $10.82 and Tire & Wheel up $81.66 — indicating improved pricing strategies or customer mix.
Curious how your dealership’s performance compares to the national average for Q2 2025?
Contact Kyle Reid for a walk-through of our FinanceVision, SalesVision and/or ServiceVision platforms and see how this reporting tool differentiates itself from the rest of the auto industry with a focus on accuracy and ease of use.
Kyle Reid
VP of Strategic Partnerships
904-315-4767
kreid@visionast.com