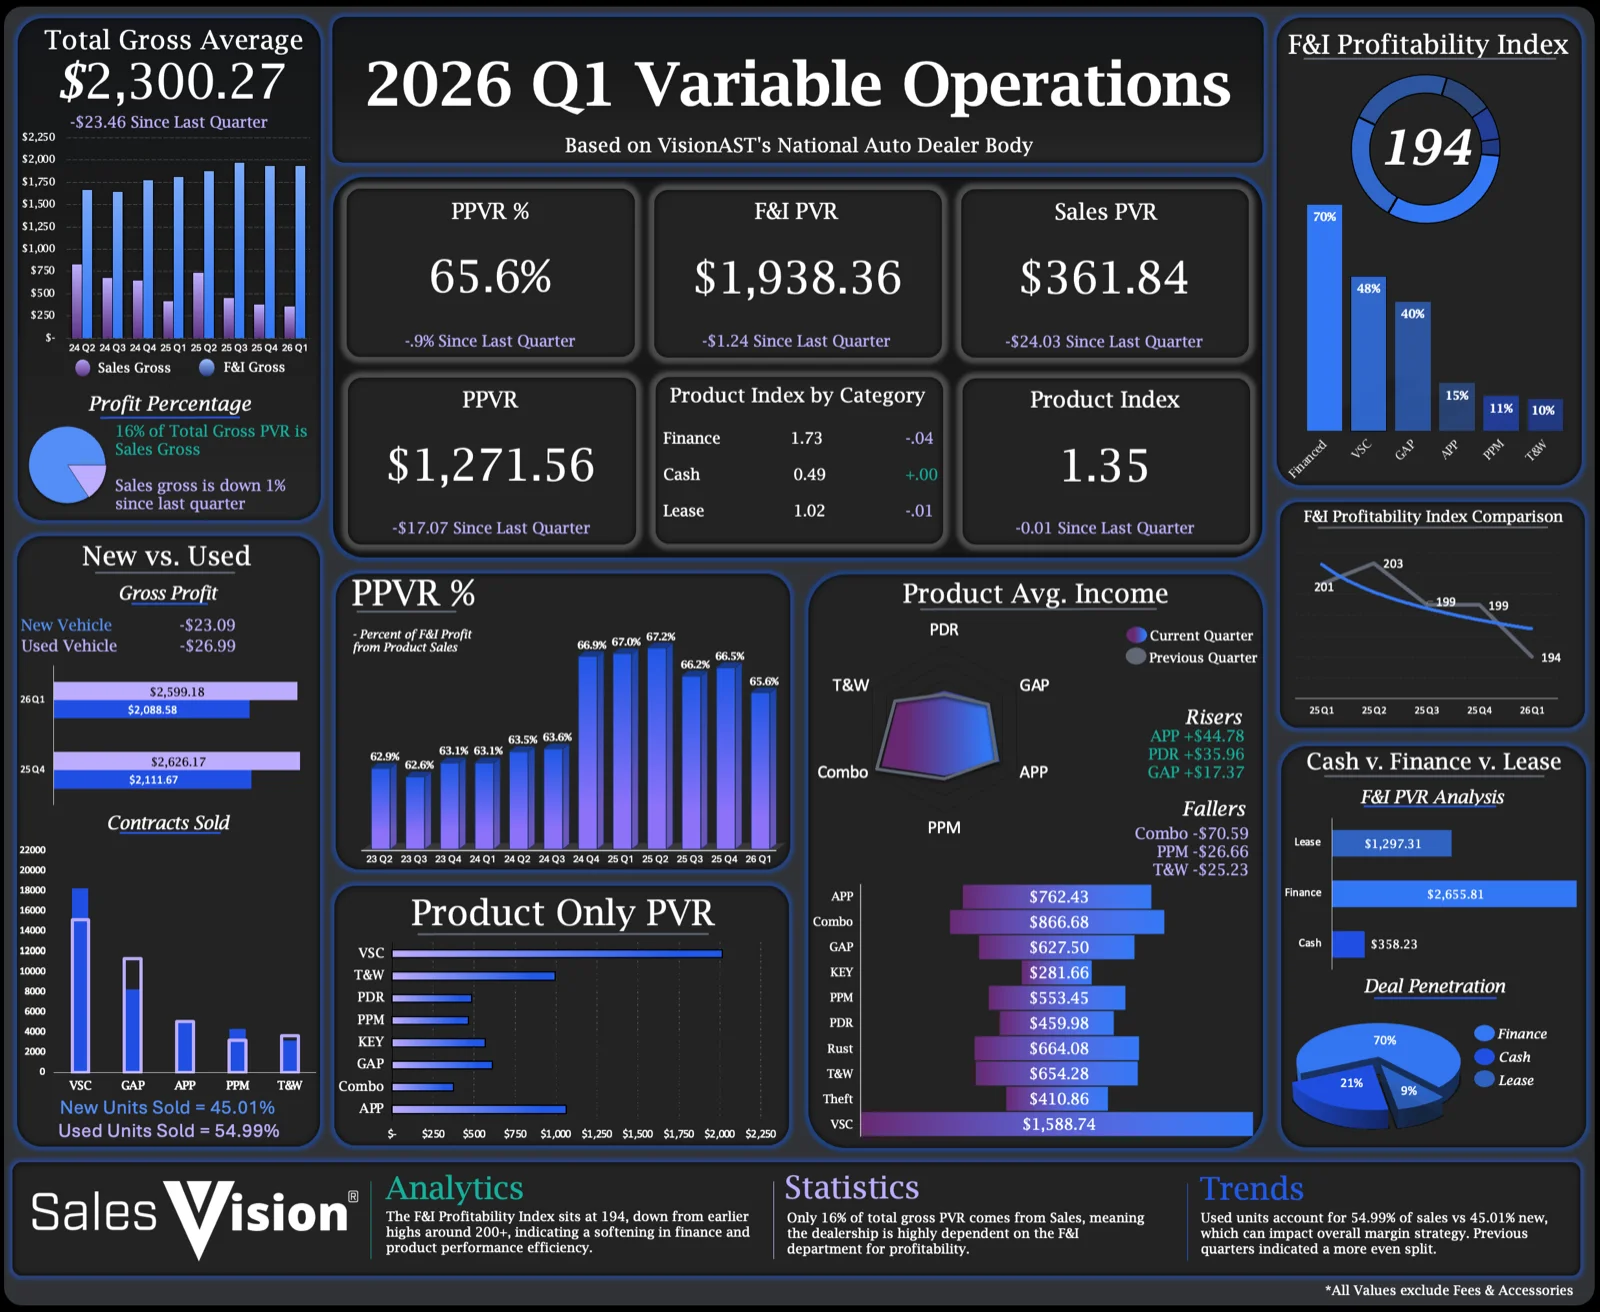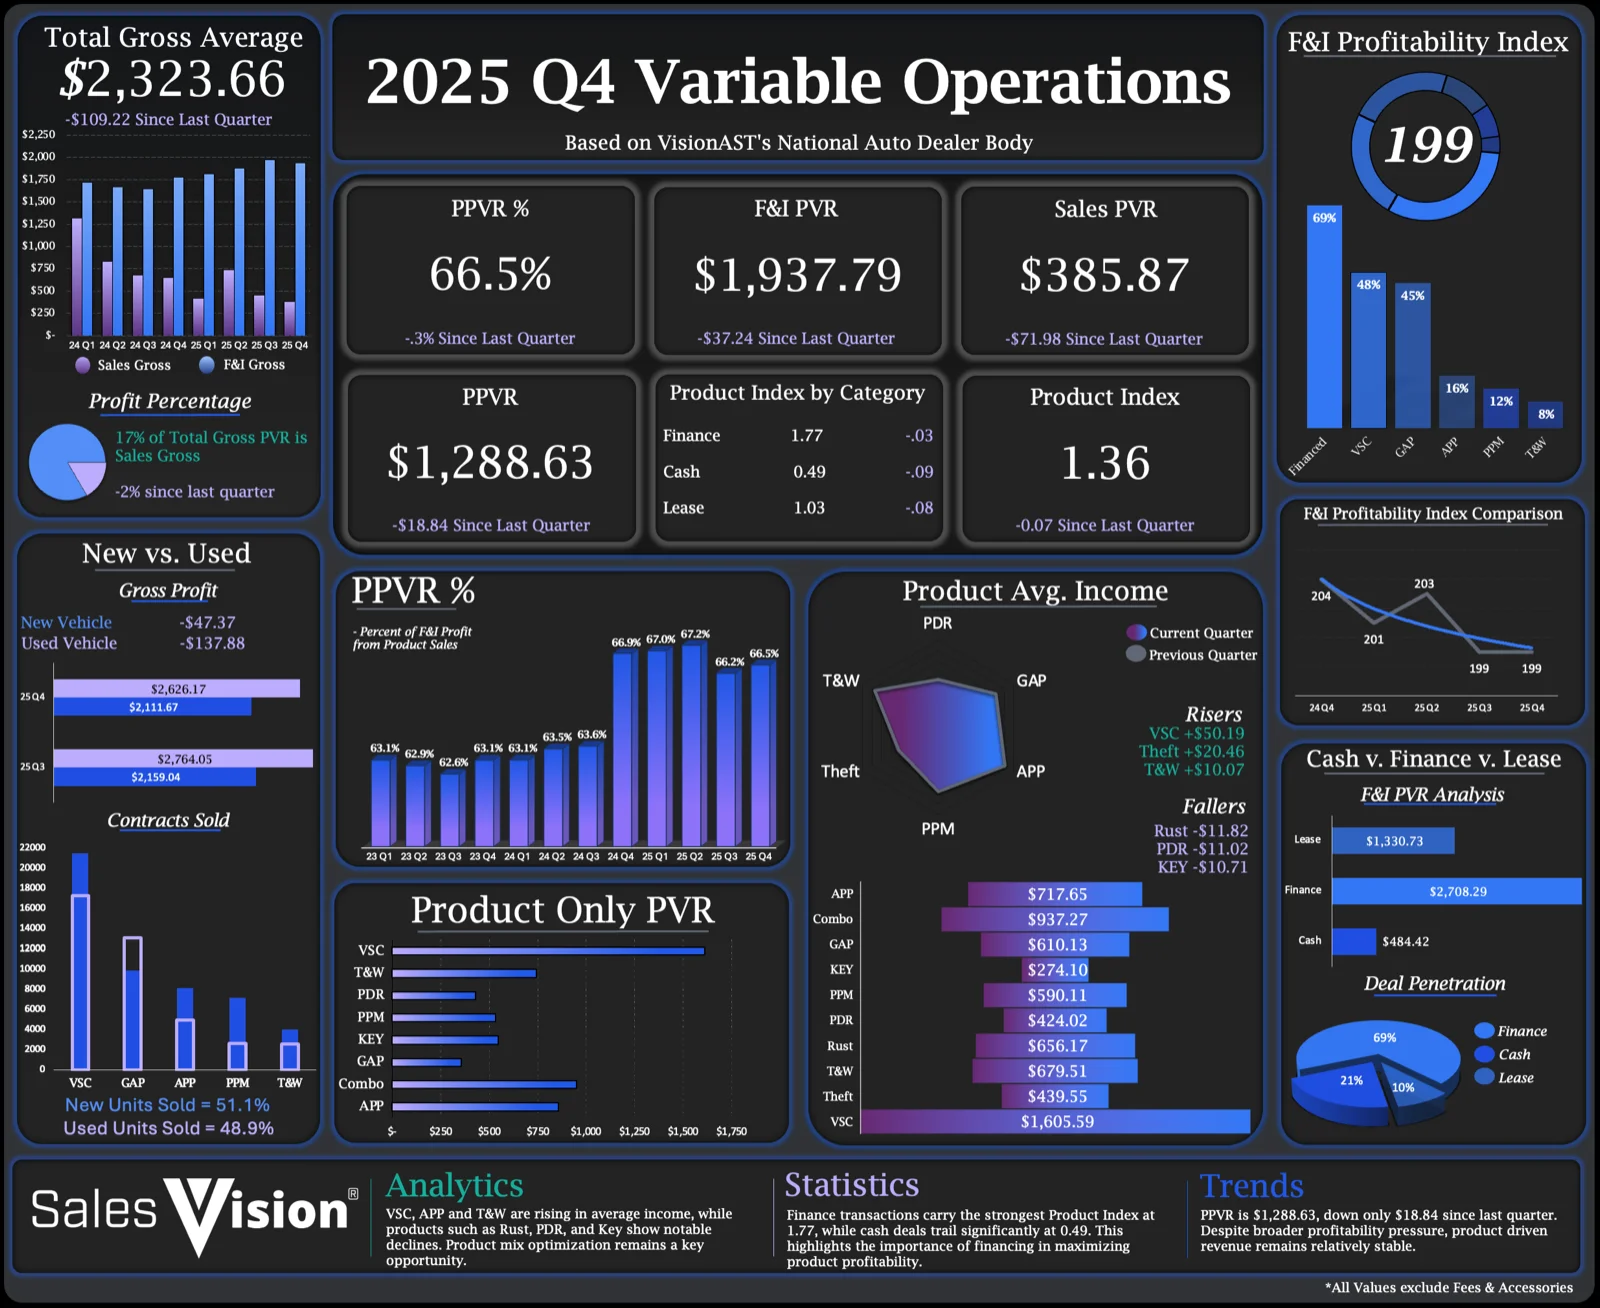
VisionAST recently released to customers, their Q2 2024 quarterly benchmark report, which encompasses performance of their entire dealership client base. Dealers can use the report to compare their own operation to the live reporting available to them.
Some key Q2 trends for variable operations worth noting:
Compared to Last Quarter
- Sales gross is down nearly $500/deal.
- Sales gross has decreased every quarter since Q1 2022 with the exception of Q2 2023.
- F&I product penetration increased on all products except Theft (-.35%).
- VSC penetration on used units increased 5% and average income decreased $5.37/deal.
- VSC penetration on new units decreased 5% and average income decreased $34.18/deal.
- F&I product average income increased for GAP (+$23.21), Key (+$74.80) and Appearance (+$45.37).
- T&W (-$56.92) and Combo Bundle (-$33.93) showed the largest decreases.
- Sales gross PVR: -$1,170.60
- F&I Gross PVR: -$108.60
- Total Gross PVR: -$1,279.20
- Units per quarter are down 20 per dealership.
Curious how your dealership’s performance compares to the benchmarks for Q2 2024?
Contact Kyle Reid for a walk-through of our FinanceVision, SalesVision and/or ServiceVision platforms and see how this reporting tool differentiates itself from the rest of the auto industry with a focus on accuracy and ease of use.
Kyle Reid
VP of Strategic Partnerships
904-315-4767
kreid@visionast.com